In this detailed article, you will study the Carnot cycle and the Carnot Theorem in depth.
What is a Carnot Cycle?
This cycle was designed by “Carnot” who was the first scientist to analyze the problem of the efficiency of a heat engine, ignoring its mechanical details. He focused his attention on the basic features of a heat engine.
Carnot Theorem
According to Carnot’s Theorem as Byjus wrote in their article:
Any system that operates between T1 (hot reservoir) and T2 (cold reservoir) will never be more efficient than a Carnot engine running between the same reservoirs.
Furthermore, the efficiency of this kind of engine depends solely on the temperature of the hot and cold reservoirs and is not affected by the composition of the working material.
Working of Carnot Cycle
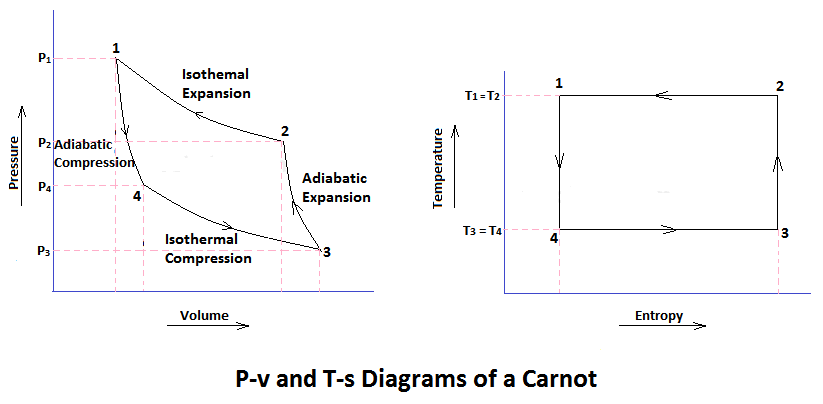
In a Carnot cycle, the working substance is subjected to a cyclic operation consisting of two isothermal and two adiabatic processes. The engine developed by Carnot has air (which is assumed to work as a perfect gas) as its working substance enclosed in a cylinder, in which a frictionless piston A moves.
The walls of the cylinder and piston are perfect non-conductors of heat. But the bottom B of the cylinder is an ideal conductor of heat. However, the bottom B of the cylinder can be covered, at will, by an insulating cap I.C. The engine is assumed to work between two sources of infinite capacity—one at a higher temperature and the other at a lower temperature.
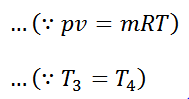
Now, let us consider the four stages of Carnot’s cycle. Let the engine cylinder contain m kg of air at its original condition represented by point 1 on the p-v and T-s diagrams. At this point, let p1, T1, and v1 be the pressure, temperature, and volume of the air, sequentially.
Read also: What is a Thermodynamic Cycle? Its Classification & Working
Carnot Cycle Processes
- Isothermal Expansion
- Adiabatic or Isentropic Expansion
- Isothermal Compression
- Isentropic Compression
Process 1-2 Isothermal Expansion
- The source (hot body, H.B.) at a higher temperature is brought in contact with the bottom B of the cylinder.
- The air expands, practically at constant temperature T1, from v1 to v2.
- It means that the temperature T2 (at point 2) equals the temperature T1.
- This isothermal expansion is represented by curves 1-2 on the p-v and T-s diagrams in the figure.
- The heat supplied by the hot body is fully absorbed by the air and is utilized in doing external work.
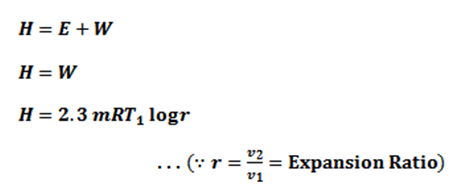
∴ Heat supplied = Work done during isothermal expansion
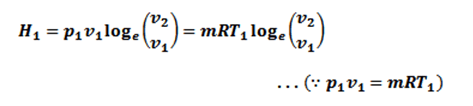
Since the temperature is constant, there is no change in internal energy of the air, i.e E=0. According to the first law of thermodynamics.
Process 2-1 Adiabatic or Isentropic Expansion
- The hot body is removed from the bottom of the cylinder B and the insulating cap I.C. is brought in contact.
- The air is now allowed to expand adiabatically. Thus adiabatic expansion is represented by the curve 2-3 on p-v and T-s diagrams.
- The temperature of the air decreases from T2 to T3.
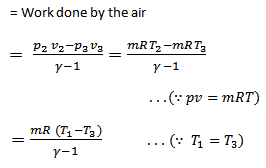
- Since no heat is absorbed or rejected by the air, therefore decreases in internal energy.
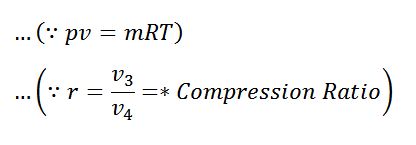
Process 3-4 Isothermal Compression
- Now remove the insulating cap I.C. from the bottom of the cylinder and bring the cold body CB in its contact.
- The air is compressed practically at a constant temperature T3 from V3 to V4.
- It means that the temperature T4 ( at point 4) is equal to the temperature T3.
- This isothermal compression is represented by the curve 3-4 on the P-V and T-s diagram.
- It would be seen that during this process, the heat is rejected by the cold body and is equal to the work done on the air.
∴ Hear rejected = Work done on the air
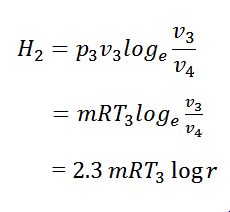
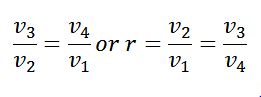
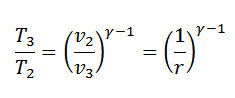
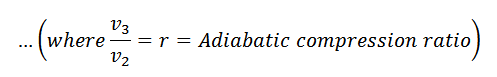
The expansion and compression ratios (r) must be equal, otherwise, the cycle would not close.
We know that for adiabatic expansion 2-3
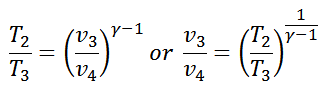
Similarly, for adiabatic compression process 4-1,
Since T1=T2 and T3=T4, therefore
Process 4-1 Isentropic Compression
- Now again the insulated cap I.C. is brought in contact with the bottom of cylinder B, and the air is allowed to be compressed adiabatically.
- The adiabatic compression is represented by the curve 4-1 on the p-v and T-s diagram.
- The temperature of the air increases from T4 to T1. Since no heat is absorbed or rejected by the air, therefore
Increases in internal energy
= Work done on the air
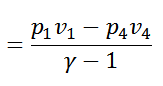
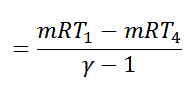
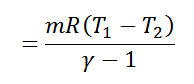
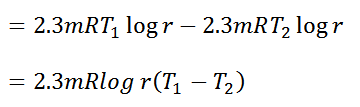
We see from the above discussion that the decrease in internal energy during adiabatic expansion 2-3 is equal to the increases in internal energy during adiabatic compression 4-1. Hence their not effect during the whole cycle is zero. We know that.
Work done = Heat supplied – Heat rejected
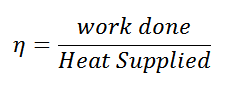
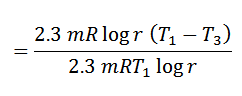
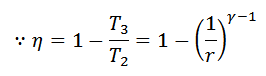
and efficiency
Corresponding we know that for adiabatic compression 2-3,
Carnot Cycle Efficiency
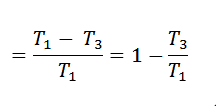
- From the above equation, we see that the efficiency of Carnot’s cycle increases as T1 is increases or T3 is decreased.
- In other words, the heat should be taken in at as high a temperature as possible, and rejected at as low a temperature as possible.
- It may be noted that 100% efficiency can be achieved. Only if T3 reaches absolute zero, though it is impossible to achieve in practice.
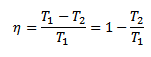
- In the above theory, we have taken the temperature at points 1,2, 3 and 4 as T1, T2, T3, and T4 respectively in order to keep similarity between Carnot cycle and other cycles.
- But some authors take it T1 (For points 1 and 2) and T2 9for points 3 and 4).
- In that case, they obtain the relation for efficiency as,
- It can be noted that it is difficult to make the engine work on Carnot’s cycle.
- The reason for the same is that the isothermal expansion 1-2 will have to be carried out very slowly to ensure that the air is always at temperature T1.
- Thus, the isothermal compression 3-4 will have to be taken out very slow.
- But adiabatic expression 2-3 and adiabatic compression 4-1 should be carried out as quickly as possible, to approach ideal adiabatic conditions.
- We know that sudden changes in the speed of an engine are not possible in actual practice.
- It is difficult to eliminate friction between the multiple moving parts of the engine, and also heat losses due to conduction, radiation, etc.
- Thus, it is difficult to realize Carnot’s engine in actual practice.
- However, such an imaginary engine is used as the ultimate standard of comparison of all heat engines.
Reversed Carnot Cycle
The Carnot cycle heat-engine can be called as a fully reversible cycle. That is all the processes that form can be reversed, in which case it becomes the Carnot refrigeration cycle. This time, the cycle remains the same but the directions of heat and work interactions are reversed.
The heat is absorbed from the low-temperature reservoir, heat in the high-temperature reservoir is rejected, and a work input is needed to achieve all this. The P–V diagram of the reversed Carnot cycle is the same as for the Carnot cycle except that the directions of the processes are reversed.
That’s it. Thanks for reading if you have any question about “Carnot Cycle” you can comment below. If you found this article helpful share with your friends.
Want free PDFs direct to your inbox? Then subscribe to our newsletter.
they the best notes really
Thank you very much 🙂