In this article, you will learn about the What is Stirling Cycle and its Efficiency with P-V and T-S Diagram. All are explained with Names & Pictures.
Stirling Cycle
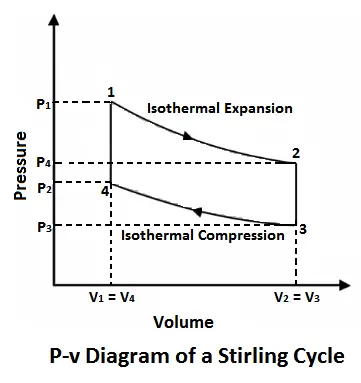
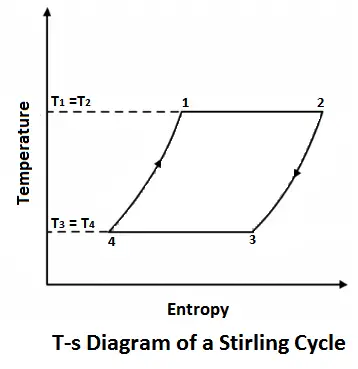
Stirling cycle was devised by Stirling, which consists of two isothermal processes and two constant volume processes. The last two processes are performed with the help of a refrigerator to make this cycle reversible. The p-v and t-s diagrams of this cycle are shown in the figure.
Let us now consider the four stages of the Stirling cycle. Let the engine cylinder contain m kg of air at its original position represented by point 1. At this point, let P1, T1, and V1 be the pressure, temperature, and volume of the air respectively.
Read also: Four-stroke Otto-cycle Spark-Ignition Engine with [P-v and T-s Diagram]
Stages of an Ideal Stirling Cycle
Following are the four cycles of an Ideal Stirling Cycle:
- Isothermal compression (Process 1-2)
- Constant volume cooling (Process 2-3)
- Isothermal expansion (Process 3-4)
- Constant volume heating (Process 4-1)
#1 Process 1-2 (Isothermal compression)
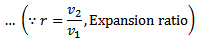
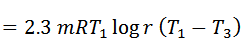
The air expands isothermal, practically, at a constant temperature, T1 or T2 from V1 to V2. It means that the temperature T2 (at point 2) is equal to temperature T1. This isothermal expansion is represented by the graph 1-2 in fig. 5-5 (a) and (b). The heat supplied by the external source is absorbed during this process.
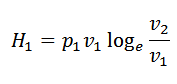
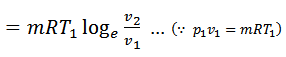
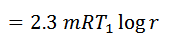
Heat supplied = Work done during isothermal expansion
#2 Process 2-3 (Constant volume cooling)
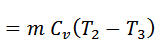
The air now passes through the regenerator and is cooled at constant volume to a temperature T3. This process is represented by a graph 2-3 on p-v and T-s diagrams. In this process, heat is rejected by the regenerator.
#3 Process 3-4 (Isothermal expansion)
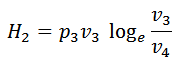
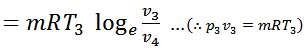
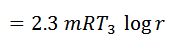
The air is now compressed isothermally, practically, at a constant temperature T3 in the engine cylinder from V3 to V4. This process is represented by the graph 3-4 on p-v and T-s diagrams. Again, heat is rejected by the air during this process.
#4 Process 4-1 (Constant volume heating)
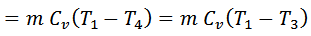
Lastly, the air is heated at a constant volume to a temperature T1, bypassing it through the regenerator in the reverse direction to that of processes 2-3. It may be noted that the air restores initial condition at the end of this process, and completes the cycle. It is thus obvious, that the heat is absorbed by the air from the regenerator during this process, i.e., 4-1.
= Heat is taken in from the regenerator

We see that the heat rejected by the regenerator during processes 2-3 is equal to the heat taken in from the regenerator during the process 4-1. Hence there is no interchange of heat to the system during these processes. The only interchange of heat is during the two isothermal processes.
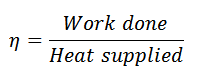
Work done = Heat supplied – Heat rejected
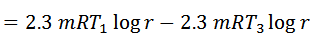
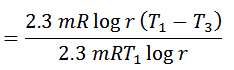
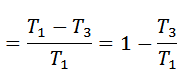
And efficiency,
Notes:
The efficiency of the Stirling cycle is the same as that of the Carnot cycle. That’s why the cycle is reversible, and all reversible cycles have the same efficiency.
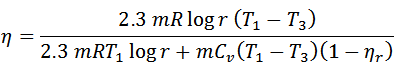
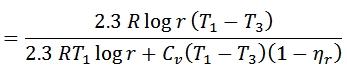
If the efficiency of the regenerator is nr then heat taken in from the regenerator during process 4-1 will be mC0 { T1-T2} (1-nr). In that case,
That’s it. Thank you so much for reading our blog. If you have any questions about the “Stirling cycle” ask in the comments section. If you like this article share it with your friends.
Want free PDFs direct to your inbox? Then Subscribe to our newsletter.
Download PDF of this article:
Read next:
- Carnot Cycle: Principle Processes, Efficiency with [P-v and T-s Diagram]
- What is Thermodynamic Cycle? Its Terms Explained
- Different Types of Condensers & Their Applications
- Working of Air Conditioning System
- Understand The Different Types of Furnaces
- What are Heat Exchangers & How It Works?
- Types of Refrigeration: Their Pros & Cons
- Different Types of Air Compressors
External Links:
In researching whether a Stirling Cycle Engine would be appropriate for my low Delta T very large heat reservoir application it appears that real Stirling engines are far from Carnot efficient. Is this true and if so where are the large losses happening in the real engines? I would expect friction losses and some uncontrolled heat flows, but the efficiencies that I am seeing are much lower than I expected.
Yes, The max efficiency is equivalent to that of Carnot but real engine is less than this because of friction and other losses. The exhaust temp is about 400 degree C and additional heat losses from wall of the combustion to the environment on outside surfaces.